This guide is part of our series on using AI for local SEO.
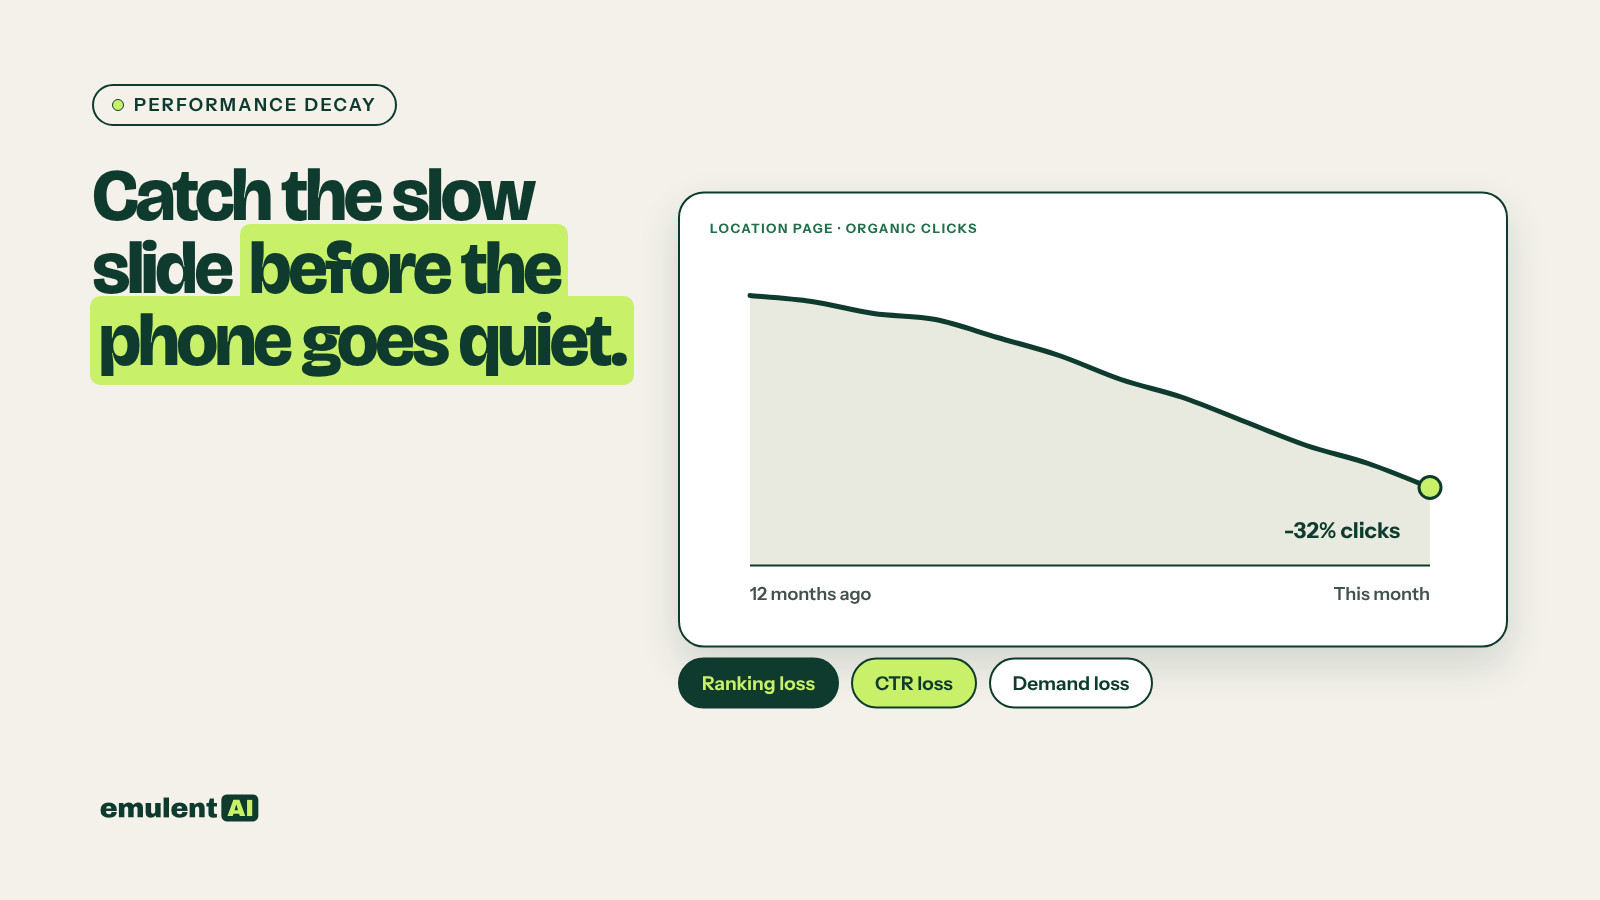
Local decay is the slow loss of clicks, map pack positions or calls on pages and profiles that used to perform. It rarely shows up as a sudden drop. A location page loses 8 percent of its clicks a month for five months, and nobody notices until a manager asks why the phone stopped ringing. AI suits this job because it can compare hundreds of pages across two time periods and separate real declines from normal noise.
What you need
- An AI assistant that accepts file uploads, such as Claude
- Google Search Console access for the site
- Google Business Profile performance data for each location
- GA4 with calls, form fills and direction clicks tracked as conversions
- A geo-grid rank tracker (Semrush Map Rank Tracker, Local Falcon or BrightLocal)
- Review counts and ratings per location
The usual causes
- A competitor opened nearby, or rebuilt its location pages
- GBP details changed: Google edited a category, hours went stale, the website link was switched to the homepage, or a suggested edit went live without anyone noticing
- Review velocity dropped while competitors kept collecting reviews
- The page went stale: old photos, staff who left, prices from two years ago
- Internal links were lost in a redesign or menu change
- Schema broke or was duplicated after a plugin update
- The results page changed: an AI Overview, Local Services Ads or a directory pushed the listing down without the ranking changing
- Page speed slipped after new scripts, sliders or tracking tags were added
- A core update reweighted the query
Step 1: Export the right data every month
Keep each month’s exports in their own folder:
- Search Console Pages report, filtered to location, service and service-in-town URLs: clicks, impressions, CTR and position. Pull the last 3 months and the same 3 months a year earlier, so seasonality does not fool you.
- Search Console queries by page for the top 50 local pages.
- GBP performance for each location: calls, website clicks, direction requests and search views.
- Geo-grid scan results for each location’s core terms (see our guide to map pack analysis for scan settings).
- GA4 conversions by landing page.
- Review count and average rating per location, with the date of the most recent review.
Step 2: Ask the AI to find and rank the declines
Attached are this quarter's and last year's same-quarter exports from Search
Console, GBP performance, GA4 and our geo-grid scans, for 14 locations and their
local pages.
1. For every location page and service+location page, calculate the change in
   clicks, impressions, average position and conversions, year over year.
2. Flag pages with a click decline of 20% or more AND at least 50 clicks in
   the earlier period (ignore tiny pages).
3. For each flagged page, look at the query data and say whether the decline is
   a ranking loss (position fell), a CTR loss (position held but clicks fell,
   which usually means the results page changed), or a demand loss
   (impressions fell with position unchanged).
4. Do the same for each GBP: flag calls or website clicks down 20% or more and
   compare against the grid scans and review data.
5. Rank all flags by lost conversions, highest first.
Output a table and a short explanation per flag. Work only from the data.
The three-way split in point 3 saves the most time. A ranking loss needs work on the page or profile. A CTR loss with unchanged rankings means something new appeared on the results page, and the fix is a better title and description or a presence in the feature that took the clicks. A demand loss means fewer people are searching, and no page edit will fix it.
Step 3: Diagnose each flagged page
For the top 10 flags, give the AI the page as it is now, an archived copy from when it performed well (from the Wayback Machine or your own backups), and the current top 3 competitor pages:
Compare our page now, our page from March 2025 when it ranked #2, and the 3
pages that outrank it today. What changed on our page (content, links, schema,
photos, phone, title)? What do the competitors have now that we do not? List
the likely causes in order of how strongly the evidence supports each one.
For GBP declines, compare the current profile to your last saved snapshot: categories, hours, website link, name, photos, services and the review count trend. If you do not keep snapshots yet, start now with a monthly export.
Step 4: Fix by cause
| Cause found | Fix |
|---|---|
| Lost internal links | Restore links from the parent location and service pages and from sibling town pages, using your linking map |
| Stale content | Add recent jobs, new photos, current staff and current prices |
| Broken or duplicate schema | Regenerate the block from your location sheet and revalidate, as in our LocalBusiness schema guide |
| GBP details changed | Correct them in the profile, then check weekly for a month in case Google reverts them |
| Review velocity drop | Restart a review request process tied to completed jobs at that location |
| Results page changed, CTR down | Rewrite the title and meta description, and make sure the page answers the query directly enough to be cited in AI Overviews |
| Competitor improvement | Compare their page section by section with yours and close the gaps |
| Slower page | Run PageSpeed Insights, remove unused scripts and oversized images, and check server response time with your host |
| Demand loss | No page fix; note it and watch the trend |
On WordPress sites hosted with Kinsta, the APM tool in MyKinsta shows which plugins and database queries slow a page down, which helps when the speed loss came from a plugin update.
Step 5: Log every fix and measure it
Keep a change log with the date, page, cause found and fix made. After 6 to 8 weeks, ask the AI to compare each fixed page’s numbers with the period before the fix. Over a year this log shows which fixes bring rankings back for this particular business, so you spend time on those first.
Step 6: Set alerts so you catch decay early
A monthly review catches decay within a few weeks. For faster warning, set up a Looker Studio dashboard or a scheduled export that compares each location page’s clicks to its 90-day average and flags any page more than 25 percent below it. A weekly check of each GBP for changed details catches edits Google applied on its own before they cost a month of calls.
Put this to work with Bill.
Tell Bill which locations and towns matter most to you. He’ll tell you which of these workflows to run first.
Contact Bill directly
Or call 773-791-3197