This guide is part of our series on AI for SEO reporting and analytics.
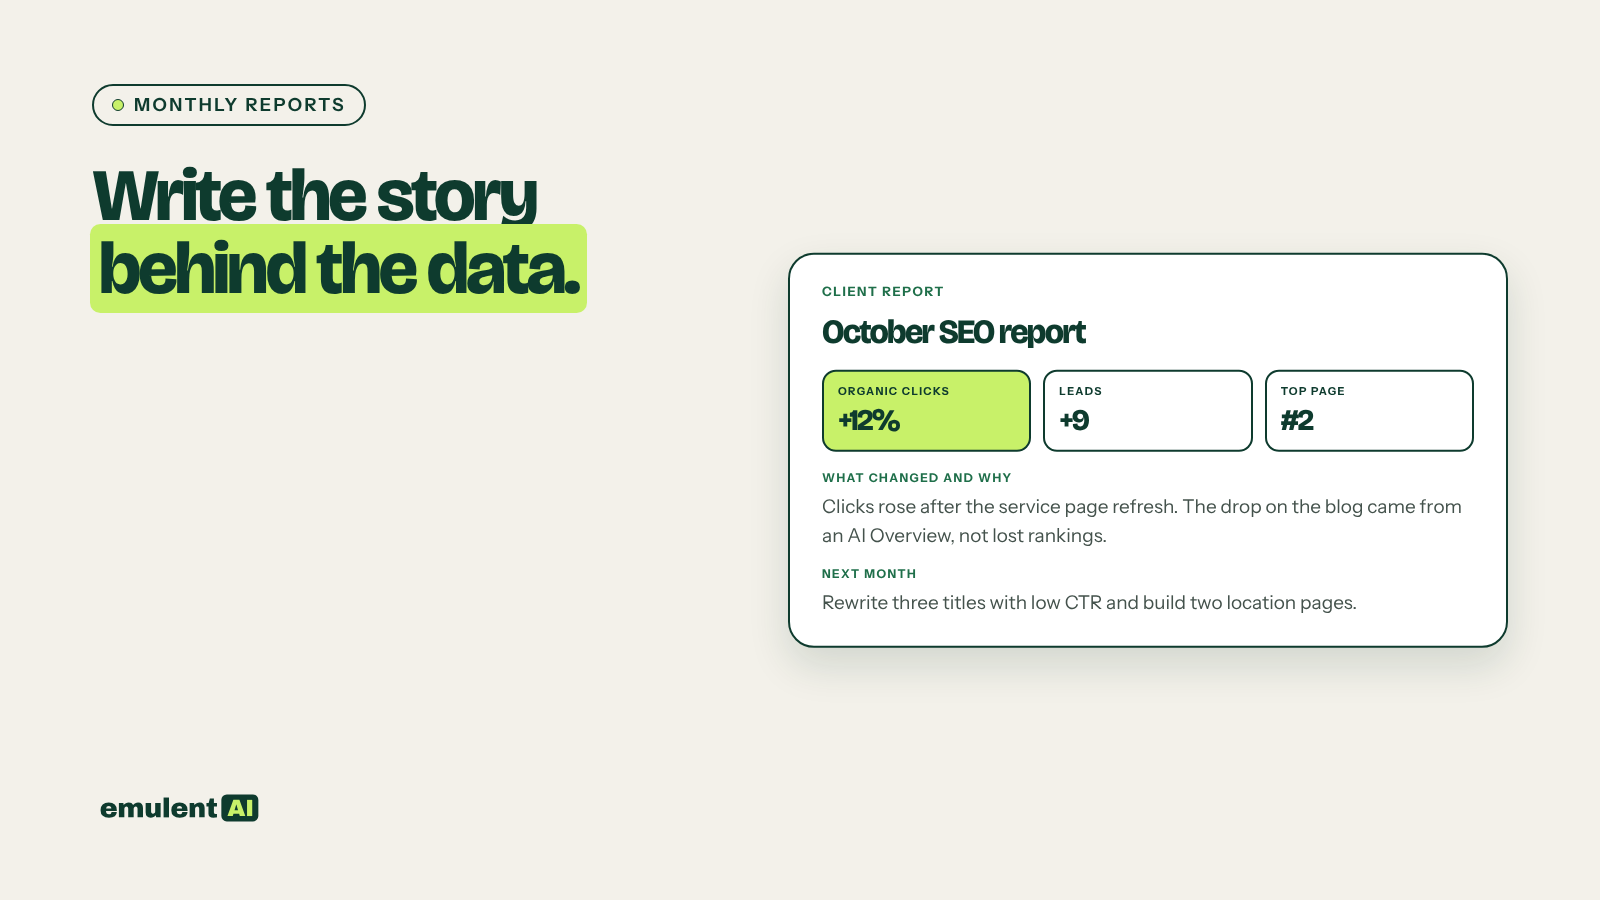
A monthly SEO report should answer three questions for the client: what changed, why it changed, and what happens next. Most reports answer the first with charts and skip the other two, because writing the explanation for each client every month takes hours. AI can draft that explanation from the same exports you already pull, as long as you tie every claim to the data and review the draft before it goes out.
What you need
- GA4: organic sessions, engaged sessions and key events, total and by landing page
- Google Search Console: clicks, impressions, CTR and position, total and by page and query
- Semrush Position Tracking: rankings and visibility for tracked keywords, with competitors
- Google Business Profile performance for each location, if the client is local: calls, website clicks, direction requests
- A log of work done this month and any site changes
- An AI assistant that reads CSV files, such as Claude
Step 1: Pull the same exports every month
Consistency is what makes month-to-month comparison possible. For each source, export:
- This month
- The previous month
- The same month last year (seasonality often explains more than anything else)
Save them in a dated folder per client. Keep the export settings the same: same GA4 filters, same Search Console property, same Position Tracking keyword list and location.
Step 2: Have the AI calculate the changes
Attached are this month's, last month's and the same month last year's exports
from GA4, Search Console, Semrush Position Tracking and Google Business Profile
for [client].
1. Build a summary table: organic sessions, key events, Search Console clicks
   and impressions, average position, Semrush visibility, GBP calls, website
   clicks and direction requests. Show each metric for all three periods with
   month-over-month and year-over-year change.
2. List the 10 pages with the largest click gains and the 10 with the largest
   losses, year over year.
3. List tracked keywords that entered or left the top 3 and top 10.
4. Note which competitors gained or lost visibility.
Show formulas for every percentage. Output tables only.
Check the summary table against GA4 and Search Console directly before going further. If a number is wrong here, everything written from it will be wrong too.
Step 3: Have the AI explain the changes, with evidence
Using the tables you built and the attached work log, explain the main changes.
Rules:
- Every explanation must point to specific data: a page, a keyword, a date, a
  work log entry.
- Label each explanation CONFIRMED (the data clearly shows it), LIKELY or
  POSSIBLE.
- If a change has no clear explanation in the data, say so. Do not invent
  causes.
- Separate changes caused by our work from changes caused by outside factors
  (seasonality, competitors, Google updates).
The labels stop the report from presenting guesses as facts. A client who hears “the March core update caused the drop” and later learns it was a broken form will trust the next report less.
If organic clicks or key events fell sharply, run a proper investigation before writing this section; our guide to investigating traffic drops walks through it.
Step 4: Draft the report
Use a fixed structure so clients know where to look:
- Summary: three to five sentences on the month, in plain words
- Results: the summary table and two or three charts
- What changed and why: the explanations from step 3
- Work completed: from the work log, tied to results where possible
- Leads and sales: key events by landing page, and which pages brought them (see our guide to conversion path analysis)
- Next month: three to five planned actions, each with the reason
Write the monthly report for [client] using the structure above. The reader is
[business owner / marketing manager]. Use plain words and define any SEO term
you use. Keep the summary under 100 words. Lead with business results (calls,
leads, sales) before rankings and traffic. Do not use phrases like "exciting
progress" or "great month"; let the numbers speak.
Step 5: Review before sending
The person who manages the account reads every report before it goes out. Check:
- Every number in the text matches the tables, and the tables match the source tools
- Every cause is supported by the data and labeled honestly
- Nothing is mentioned that the client should hear in a call first, such as a big drop or a mistake on your side
- Next month’s actions are realistic and agreed with your team
Step 6: Save time next month
Save the prompts, the report template and the export settings for each client. Reports for multiple clients can follow the same steps with different data. For clients who want live numbers, a Looker Studio dashboard can show the charts between reports, with the AI-drafted narrative delivered monthly.
Put this to work with Bill.
Send Bill your exports and tell him what you are trying to fix. He’ll tell you which of these workflows to run first.
Contact Bill directly
Or call 773-791-3197